
Most of us have cooked something using a recipe. Follow the steps as they are written and you end up with something edible, most of the time. Beside the recipe itself, there are two import items you must have to be successful: the right ingredients and the proper tools.
When putting together an air quality permit application, there is more to it that just following the guidance. To increase your chances of success, it helps to have the right ingredients and the right tools.
Federal NSR and Netting
If a site is existing and already a major source of emissions, and a new project is being proposed at the site, the project emission increases are determined by the following:
- If new facilities are being constructed, the project emission increase is the sum of the new facilities’ potential to emit (PTE); or
- For existing modified facilities or affected facilities, the project emission increase is determined by comparing the modified or affected facilities planned emission rate to the baseline actual emission rate.
Determining the PTE is relatively straight forward. You add up the PTE for each facility and there you go. Determining the baseline actual emission requires more than just a recipe (guidance) to follow. You have to have the right ingredients (data) and the right tools like NaviKnow’s Air GeoDataBase (Air GDB). The air GDB has a wealth of international, national, but mostly, Texas datasets. Our long-term goal is to increase the amount of data available outside of Texas.
Using the Air GDB for Baseline Actual Emission Rates
To use the Air GDB you must have some kind of GIS software available to you, such as ESRI’s ArcMap. We are not endorsing any products. It is just what we use.
First, launch ArcMap. To fill in your blank map, click on the Add Data icon ![]()
Locate where you have the Air GDB, then expand it to see all the datasets available. There are only two datasets to add for this example:
- PROPERTIES; and
- PROPERTY_LINES.
The PROPERTIES (points) and PROPERTY_LINES (polygons) datasets were obtained from the Texas Commission on Environmental Quality (TCEQ). They contain locations of industrial sites in Texas. Though they appear as just two datasets, but due to the power of the GDB, there are actually about a dozen datasets accessible through the two parent datasets.
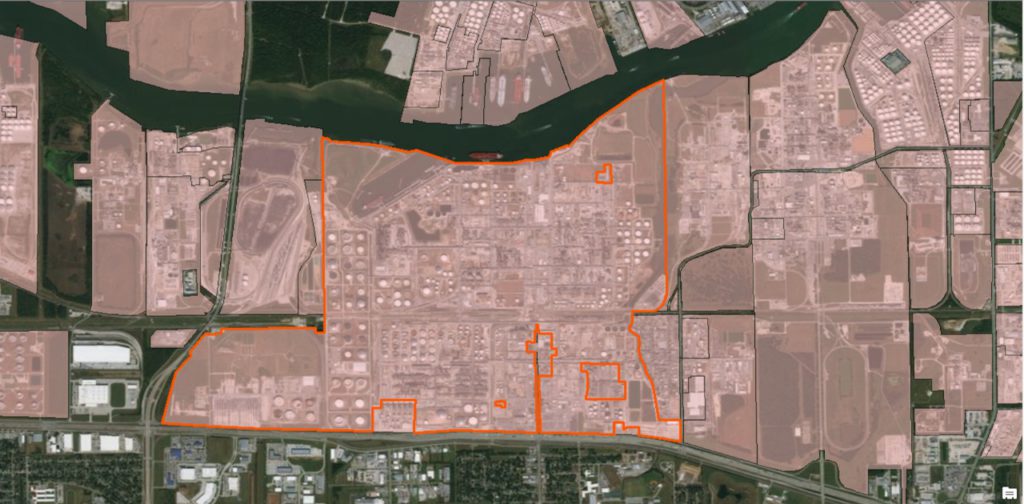
To get started, locate the industrial site of interest, then zoom in to have a better view. Next, select the location of the application site by using the Select Features icon ![]()
For this example, we have chosen a site in eastern Texas. Our map display looks like this:
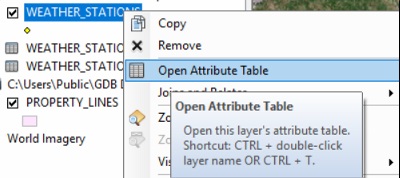
Once we have selected our site, we will need to access emissions inventory data for the ten year period immediately preceding either the date the owner or operator begins actual construction of the project, or the date of a complete permit application submitted to the TCEQ. To do so, we will navigate to the data table that contains these data. Right-click on the PROPERTY_LINES dataset, then select Open Attribute Table.
We will see the selected record in bright blue. In the PROPERTY_LINES attributes table, only identifying information is contained in this table. The emissions data is located in a related table a few hops away. To access the related table with emissions data, click on the related tables icon ![]()
Select the PROPERTIES table. Click on the related tables icon, again. This time select SOURCES. Click on the related tables icon one more time, then select SOURCE_RATE_RPT. This table contains reported annual emission rate at the emission source level for each reported air contaminant. The Air GDB contains emissions data from 2006 to the most recent inventory.
To perform the analysis, we do not need all of the emissions data. We only need the emission rates for the air contaminants of interest, i.e. the criteria pollutants. To filter of the data, so we only see the data we need, click on the Select By Attributes button ![]() .
.
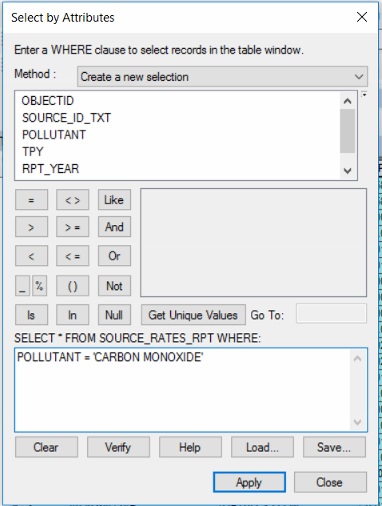
The Select by Attributes dialog box opens, listing the data fields to filter (query) on. We want to select those records, selected from the current selection, that have the pollutant equal to the criteria pollutant names. For this example, we only want to see the carbon monoxide emission rates. For the other criteria pollutants, you can perform a similar query for each pollutant name. The dialog box should look like this:
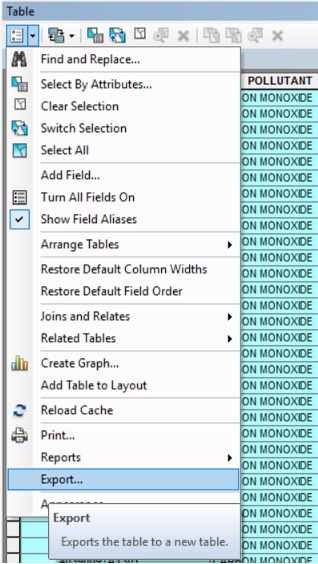
You can export the query results by clicking on the File Options icon, and then selecting Export…
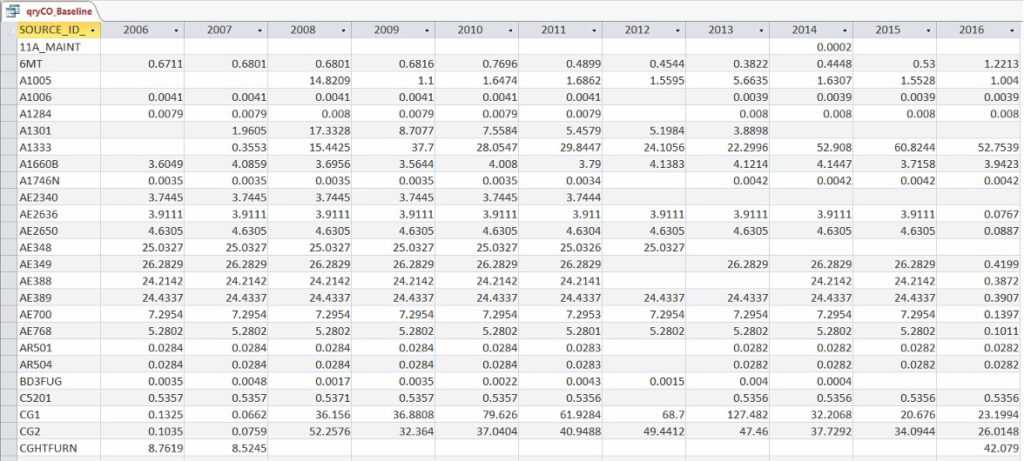
It is recommended you save the results in either Text or dBase formats so you can easily import the data to a spreadsheet of database program. Once you have imported the results, you can now reformat the data as you see fit to determine the baseline emission rate during any consecutive 24-month period.
For this example, my results looked like this:
Best Available Control Technology (BACT) Analysis
The TCEQ guidance on BACT states:
In the first tier, an applicant’s BACT proposal is compared to the emission reduction performance levels accepted as BACT in recent NSR permit reviews for the same process and/or industry, which can be identified by the principal company product or business, Standard Industrial Classification (SIC) Code and the North American Industry Classification System (NAICS) system code.
This sounds simple enough, but how to you do this?
Using the Air GDB for BACT Tier I
Using the same two datasets, PROPERTY_LINES and PROPERTIES, we will find the SIC code for our selected site and locate all sites in the state with the same SIC code. From that point, we can drill down through the related data tables to see what control technologies are being used for specific facility (equipment) types.
To start, right-click on the PROPERTY_LINES dataset, then select Open Attribute Table. Click on the related tables icon, select PROPERTIES. Click on the related tables icon, again. This time select PROPERTY_INDSTRL_CLASS. The site we have selected for this example has an SIC code of 2911 and a NCICS code of 324110. For this example, we are going to use the SIC code.
To select all other sites with the same SIC code in the state, we are going to create a new selection by querying the table PROPERTY_INDSTRL_CLASS with the following statement of criteria:
INDSTRL_CLASS_SYS = 'SIC' AND INDSTRL_CLASS_CODE ='2911 '
Now that we have selected all sites with the same SIC code, we need to navigate to the data showing the control devices these site currently use for specific facility type. To do so, let’s go to the related tables icon, click, then select PROPERTIES. Click on the related tables icon, again. This time select FACILITIES. This table provides a listing of all the facilities (and their facility type) at all the site we are interested in.
We are interested in all the facilities for our BACT Tier 1 analysis, but just certain ones that pertain to our proposed project. For this example, our project will be adding some new boilers. Next click on the Select By Attributes button. Now we will query the FACILITIES table to list only boilers by using the following query:
FACILITY_TYPE = 'BOILER'
It is important to note, the Method: text box is set to Select from current selection.
At this point, we will see all the boilers at sites similar to our application site. To narrow our search further, click on the Related Tables icon, and select FACILITY_PROPS. This table contains facility property values such as design capacity.
If we have narrowed our search by one or more of the facility property values, go to the Related Tables icon again and click to go back to the FACILITES table. From here, click on the Related Tables icon, and then select the CONTROLS table. Finally, we have a listing of the control technology in use by sites similar to our application site. This gives us most, if not all the information needed for the Tier 1 portion of our BACT analysis.
Summarizing
In this article we have stepped through how to access the information needed or required to perform a Baseline Actual Emissions for federal NSR applicability and a BACT Tier 1 (TCEQ) analysis using the NaviKnow Air GDB. All the data used, you can obtain on your own, however, you will need to massage, reformat, and clean up before you can use it. The Air GDB takes care of all that for you and puts the data right at your fingertips.
If you found this article informative, there is more helpful and actionable information for you. Go to http://learn.naviknow.com to see a list of past webinar mini-courses. Every Wednesday (Webinar Wednesday), NaviKnow is offering FREE webinar mini-courses on topics related to air quality dispersion modeling and air quality permitting. If you want to be on our email list, drop me a line at [email protected].
One of the goals of NaviKnow is to create an air quality professional community to share ideas and helpful hints like those covered in this article. So if you found this article helpful, please share with a colleague.
If you are interested in learning more about the NaviKnow Air GDB, go to http://www.naviknow.com/geodatabase/. You are welcomed to give it a test drive by going to http://www.naviknow.com/geodatabase-trial/ for a 30-day trial.