There are many things that have a name but are not what their name indicates. For example, a panda bear is not a bear at all, but a big racoon. A peanut is not a nut. It’s a legume (a bean). A horned toad is a lizard. A volume source fits into the same category.
Many years ago, dispersion models were limited to point and area source representations. A point was indicative of emissions being injected vertically into the atmosphere through a stack. An area source was meant to represent evaporative emissions from a flat surface, like a waste water pond. If the emissions you were trying to represent were closer to a 3-dimensional blob, like a cloud of dust in the wake of a large vehicle or vapor leaks from multiple layers of piping components (valves and flanges), it took a lot of imagination to make those types of sources fit into the point or area source box.
Okay, Then What Is It?
In the mid-1990’s, the volume source was introduced. The volume was meant to provide an option for those type of emissions that are more 3-D and not 0-D (point) or 2-D (area). Though the volume source appeared to be something new (and 3-D) it uses the existing POINT source construct. Simply, a VOLUME is really a special case POINT source(s).
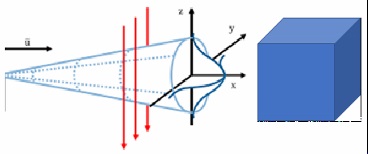
If you look at the input parameters for a volume, initial horizontal dispersion and initial vertical dispersion, you are providing the input for the model to construct two POINT sources. In reality, the model uses the initial horizontal dispersion to construct one POINT source with a virtual location that would have the same horizontal dispersion where VOLUME location is, and a second POINT source with a virtual location that would have the same vertical dispersion where VOLUME is located. So, a VOLUME is actually two POINT sources with virtual locations based on the hourly meteorological conditions. To be honest, this was quite a clever idea.
Though the virtual POINT concept has been well documented, the very name VOLUME leads most people to believe this source type is perfectly representative of all 3-dimensional emission sources, such as fugitive emission coming from doors, windows, and vents due to operations inside of a large manufacturing building. Though a VOLUME may be the most representative of the source types available in certain cases, there are a few nuances to be aware of if you choose VOLUME.
In the Horizontal
If you use one of the several dispersion modeling software packages on the market, some of the packages graphically represent a VOLUME in the interface as a square. The size of that square is typically based on the value of the initial horizontal dispersion for that source. Keep in mind that initial dispersion value is constant but the virtual locations of the associated POINT sources are changing with every hour. If you base the initial horizontal dispersion on the dimensions of a building, which dimension do you select, length or width? If the building aspect ratio is about one, it really doesn’t matter. If you are trying to represent a long narrow building as a single VOLUME, this will be appropriate only for certain wind directions. If you placed the location of the VOLUME at the centerline of the building, then you will be representing emissions from only a portion of the building and not most of the building or providing more dispersion for emissions that are not really there, depending upon which way the wind is blowing.
For the case of a building with an aspect ratio greater than one, it may be more appropriate to represent the emissions as multiple VOLUMEs.
In the Vertical
If you are wanting to use VOLUME to represent multiple levels of process piping fugitive emissions, I have a true story to tell you may find helpful and inciteful.
While at the TCEQ, I was reviewing an air quality analysis for air toxics. The primary source of emissions was the process fugitive emissions from six vertical levels of piping components. The consultant that performed the modeling had used information from the leak detection and repair (LDAR) program their client had been implementing for several years. The consultant distributed the emissions by level as they had used the component counts for each of the six levels. As a result, they represented the emissions as six VOLUME sources, one on top of the other. It seemed like a good idea to break up the emissions to be more realistic.
When reviewing the modeling results, the predicted concentrations were HUGE. I double checked the numbers and everything was consistent. I couldn’t figure out why breaking the emissions up would produce such high concentrations. As a test case, I represented the emissions as one big VOLUME since the process area was square. The results were 10 times LOWER! What?
I thought about it for a few minutes, then I remembered that a VOLUME is actually two POINTs. The virtual location of the POINTsares based on the initial dispersion, horizontal and vertical. The initial horizontal dispersion was based on the width of the process area, but the initial vertical dispersion was based on the height of each level, which was small compared to the overall height of the piping structure. By breaking up the emissions in the vertical, the consultant was concentrating the emissions. The virtual POINT location for the vertical dispersion was barely different from the location of each VOLUME. The representation the consultant chose was nearly equivalent to representing the emissions as a pseudo-POINT.
When I discovered all of this, I called the consultant, explained my findings, and suggested they remodel using a single VOLUME source rather than the six or so they had chosen. Their response to this was, “you mean, you want us to have lower numbers?”. My reply to them was, “No. I just want you do represent things right.”
Summary
The VOLUME source in AERMOD does give users an option to represent those type of sources that do not emit through a traditional stack or from a 2-dimensional plane. Do keep in mind that a single VOLUME source is not always appropriate for all sources that are 3-dimensional. You may have to resort to multiple volumes. Also, breaking a source into multiple volumes may have unintended consequences. You should pay close attention to the aspect ratio of the physical source both horizontally and vertically.
If you found this article informative, there is more helpful and actionable information for you. Go to http://learn.naviknow.com to see a list of past webinar mini-courses. Every Wednesday (Webinar Wednesday), NaviKnow is offering FREE webinar mini-courses on topics related to air quality dispersion modeling and air quality permitting. If you want to be on our email list, drop me a line at [email protected].
One of the goals of NaviKnow is to create an air quality professional community to share ideas and helpful hints like those covered in this article. So if you found this article helpful, please share with a colleague.