Several years ago, I was waiting at a traffic light. While I was waiting started counting the traffic signs at the intersection. By the time the traffic light turned green and I had to shift my attention to driving, I counted 50, and that wasn’t all of them. I guess somebody in government has a brother-in-law in the sign making business. Even with all of those signs giving guidance and direction to drivers, a few were ambiguous and some contradicted other signs.
When it comes to dispersion modeling, the EPA has several guidance documents to assist the modeler and provide a level and consistent playing field for industry and regulatory agencies. There are guidance memos for specific topics and guidance documents for each of the pre-processor programs and well as the primary dispersion model program. Most of the guidance memos and documents stand by themselves and are updated as needed, but other guidance, such as the Guideline on Air Quality Models (GAQM) has been codified in rule and can only be changed through the rule making process.
With all the different flavors and levels of guidance, there is bound to be at least one item that conflicts with another item. We are all human. This article will point to one, glaring guidance conflict that has been in plain sight for decades.
Determining Land Cover
The earth surface and what’s on the surface impacts meteorology. We all know this to be true. Dispersion models account for variations in land cover in various ways. When the Industrial Source Complex (ISC) model was the EPA preferred model, you had a choice between either Urban or Rural dispersion coefficients. The land cover of urban areas was definitely different and distinct from rural areas. Even with AERMOD, though only one characterization of the surface is allowed for the entire modeling domain, the user has an option to adjust the dispersion of urbanized sources.
The procedure to adequately capture the surface influences on the meteorology is so critical to modeling providing meaningful results, EPA has codified the procedure in rule in the Guideline on Air Quality Models (40 CFR 51 Appendix W) in section 7.2.1.1. The rule limits you to two methods: Land Use Procedure described by Auer; and Population Density Method described by Oke. There numerous problems with both of these procedures:
• Require significant resources to implement
• Are subjective or may not be appropriate of the area under review
• Non-repeatable and may not be realistic of the area under review
Auer Land Use Method
In Auer’s research into the urban heat island effect in St. Louis in the early 1970’s, the purpose was to correlated land use and land cover to influences on local meteorology. As a part of the study, Auer developed a land cover classification schema. The table below documents the classifications he developed for this one study. The measure of ground vegetation is the determining metric.
| Type | Use and Structures | Vegetation |
| I1 | Heavy Industrial: Major chemical, steel and fabriacation industries; generally 3-5 story buildings, flat roofs | Grass and tree growth extrememly rare; < 5% vegation |
| I2 | Light-moderate industrial: Rail yards, truck depots, warehouses, industrial parks, minor fabrications; generally 1-3 story buildings, flat roofs | Very limited grass, trees almost total absent; < 5% vegetation |
| C1 | Commercial: Office and appartment buildings, hotels; > 10 story heights, flat roofs | Limited grass and trees; < 15% vegetation |
| R1 | Common residential: Single family dwelling with normal easements; generally one story, pitched roof structures; frequent driveways | Abundant grass lawns and light-moderatly wooded; > 70% vegetation |
| R2 | Compact residential: Single, some multiple, family dwelling with close spacing; generally <2 story, pitched roof structures; garages (via alley), no driveways | Limited lawwn sizes and shade trees; < 30% vegetation |
| R3 | Compact residential: Old multi-family dwellings with close (<2 m) lateral separation; generally 2 story, flat roof structures; garages (via alley) and ashpits, no driveways | Limited lawn sizes, old established shade trees; < 35% vegetation |
| R4 | Estate residential: Expansive family dwelling on multi-acre tracts | Abundant grass lawns and lightly wooded; > 95% vegetation |
| A1 | Metropolitan natural: Major municipal, state, or federal parks, golf courses, cemetaries, campuses; occasional single story structures | Nearly total grass and lightly wooded; > 95% vegetation |
| A2 | Agricultural rural | Local crops (e.g. corn, soybean); > 95% vegtation |
| A3 | Undeveloped: Uncultivated; wasteland | Mostly wild grasses and weeds, lightly wooded; > 90% vegetation |
| A4 | Undeveloped rural | Heavily wooded; > 95% vegetation |
| A5 | Water surfaces: Rivers, lakes |
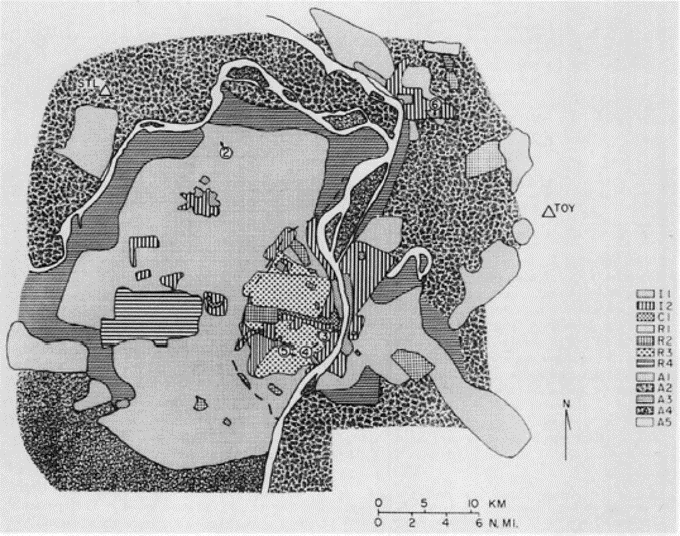
The classification schema was applied to numerous aerial photos there were taken of the St. Louis metropolitan over a three year period. Based on the photos, the following map of the area was constructed:
So, if you were to perform a modeling analysis, are you expected to go through the same procedure Auer performed during his research? If you ask any regulatory modeler, the answer will be “yes, of course.”
How would you perform this analysis today? First, you would need the following:
• Recent good quality aerial or satellite imagery that is georeferenced
• Tools to view the imagery geospatially and have the capability to construct polygons and calculate the area of the polygons
• The expertise to apply the Auer land cover classifications
• A whole of time
Granted, I am the kind of person that believes if you want to do things right, you have to put in the time and effort, but the expectation is that this type of analysis has to be done for each air quality analysis is, to put mildly, unrealistic. Also, and more importantly, if you had to defend this analysis in a courtroom setting, how would you? We are all experts, to varying degrees, in dispersion modeling, but do we have the expertise to properly classify land cover based on some public domain aerial imagery?
Would you want to subject yourself to explaining in excruciating detail how you decided an area should be classified as R2 rather than R1 or R3 instead of R4? What criteria did you use? What in your background qualifies you for this type of work? How many times have you done this? Is there any QA/QC process to make sure your decisions were properly reviewed?
Having been deposed many times, those questions above are just a start. If there are multiple parties involved in the proceeding, be prepared for rounds and rounds of the same questions over and over again. The best mental picture I can give you is imagining a gazelle surrounded by pack of very hungry hyenas. Do you want to be that gazelle?
Population Density Method
The method proposed by Oke, uses population and population density as a metric of the urban heat island effect. Though many others used a similar approach, the method runs into problems on how cities are defined. Also, the analysis looks at population and not at all the other mechanisms that can contribute to the urban heat island. Not all cities or metropolitan areas are organized or laid out in the same way. In a general sense, the correlation between population and heat island effects show correlation, but on the scale of a dispersion modeling domain, the correlation can break down.
In a similar way as with the Auer land use method, how would you apply the population density method today? You would need the following:
• Recent population in a raster or as polygons in a geospatial format
• Tools to view and analysis geospatial data
• Supplemental data to identify industrialized areas
• A methodology to equate industrial activity with equivalent population density
As in the case of Auer land use, implementing the population density method is not going to be easy and the result is most likely going to be questionable. If you have used the population density method and are going to court, there is just one question for you: do you want to be that gazelle?
The Urban Heat Island
Both the Auer Land Use and Population Density methods are supposed to provide a measure of the urban heat island effect. What is the urban heat island? On EPA’s website, it states, “The term ‘heat island’ describes built up areas that are hotter than nearby rural areas. ” The cause of the urban heat island is the increased thermal mass (capacity to store energy) and light absorption of the ground cover in urban areas compared to rural areas. Basically, there is more impervious land cover (concrete and asphalt) and less lush green areas in the city than there is out in the country.
Auer was going along the correct course by considering vegetation as metric of impact on the atmospheric dynamics, but there are many types of vegetation, e.g. grass lands, crops, forests, etc. that may have similar thermal effects on atmospheric dynamics but have varying mechanical mixing effects on the atmosphere. In his discussion on the his methodology, Auer mentions there is no one classification system that would capture all aspects, but does refer to other schema used by governmental agencies, specifically the system attributed to Anderson.
The Anderson Classification Schema
If you have used AERSURFACE, then you are familiar with the Anderson Classification Schema. A chart of the level 2 categories are listed and colored coded below.
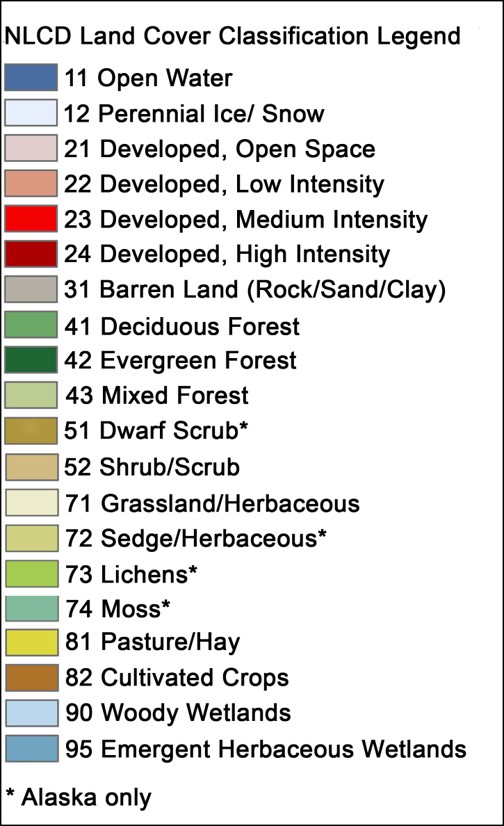
The Anderson Classification System is THE standard when it comes to land cover. Is has been in use for over 50 years and has been refined to more detailed levels. The chart above is to the second level. Also, one important aspect is, when using it, process is repeatable. The Auer method was a one-time use open to interpretation each time it is used.
The Anderson system has been adopted by multiple government agencies and academics world-wide. Even EPA has adopted it through use with AERSURFACE. The rationale for use with AERSURFACE is the data are realistic and reproducible. In addition to that, use of these data is objective and systematic. As a result, its used is easily defensible. The data have been gathered, processed, and classified by professionals.
Our Recommendation
The next time you perform your dispersion modeling, we recommend using the data based on the Anderson Classification system. The data are available from the USGS at https://www.mrlc.gov/data. The data are reliable and more importantly, defendable.
You may ask if using these data goes against EPA guidance in GAQM? The answer is a little bit “yes” and a much more “no”. Using data from the National Land Cover Datasets (NLCDs) does go against section 7.2.1.1 of the GAQM. The NLCD is neither Auer or Population density related. However, section 1.0 (d) of the GAQM states:
“Consistency ensures that air quality control agencies and the general public have a common basis for estimating pollutant concentrations, assessing control strategies, and specifying emissions limits. Such consistency is not, however, promoted at the expense of model and database accuracy.”
Two fundamental tenets of the GAQM are consistency and data accuracy. The data from the NLCD is consistent AND accurate. The data used with the Auer or Population density methods are going to be inconsistent (no two analyses will be alike) and there is no reputable dataset that we are aware of that you can use for either of these.
It should be clear, that sections 1.0 (d) and 7.2.1.1 are in conflict with each other. Since one speaks to the very reason why there is a guideline in the first place, section 1.0 should override what is in other sections of the document.
Summary
Starting in February 2019, NaviKnow will provide the means to perform an AERSURFACE-like analysis using the most recent and readily available land cover data or temporally representative land cover data for your project. No reason for you to go to extra effort. NaviKnow has taken care of the heavy lifting.
Also, NaviKnow will provide the means for dispersion modelers to download the most recent terrain data in GeoTiff format available anywhere. No need to convert files from USGS to GeoTiff yourself. We have done all that for you.
If you found this article informative, there is more helpful and actionable information for you. Go to http://learn.naviknow.com to see a list of past webinar mini-courses. Every Wednesday (Webinar Wednesday), NaviKnow is offering FREE webinar mini-courses on topics related to air quality dispersion modeling and air quality permitting. We also have articles air quality issues at http://naviknow.com/news. If you want to be on our email list, drop me a line at [email protected].
One of the goals of NaviKnow is to create an air quality professional community to share ideas and helpful hints like those covered in this article. So if you found this article helpful, please share with a colleague.